Water Quality Monitoring for Tilapia: Essential Equipment and Daily Testing Routines
Posted on: 2025-11-09
By: Yomi Adisa
Water Quality Monitoring for Tilapia: Essential Equipment and Daily Testing Routines
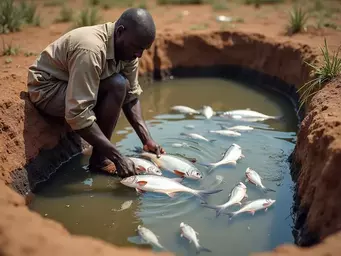
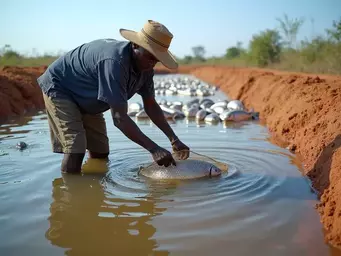
You arrive at your tilapia pond early morning, expecting to see healthy fish swimming actively near the surface. Instead, you find several floating belly-up, whilst the survivors gasp at the water's edge. This devastating scene plays out across African fish farms more often than it should, and in most cases, poor water quality is the silent culprit behind these costly losses.
📑 Table of Contents
Water quality monitoring isn't just about preventing fish kills—though that's certainly critical. It's about creating the optimal environment where your tilapia can convert feed into flesh most efficiently, resist diseases naturally, and reach market size in the shortest time possible. Poor water conditions don't just kill fish outright; they create a cascade of problems that slowly erode your farm's profitability through reduced growth rates, increased disease susceptibility, and terrible feed conversion ratios.
Your tilapia might survive in less-than-ideal conditions, but they won't thrive or deliver the profits you're working towards. Understanding water quality management transforms your tilapia farming from a gamble into a predictable production system. When you can measure, monitor, and adjust water conditions precisely, you're no longer hoping your fish will grow well—you're ensuring they will.
The difference between farms that monitor water quality systematically and those that don't can mean 30-40% better feed conversion rates and dramatically reduced mortality. This comprehensive guide provides you with complete technical guidance on the essential water quality parameters you must monitor, practical equipment options available to African farmers, and proven daily testing routines that will keep your tilapia healthy and profitable. You'll learn exactly what to test, when to test it, how to interpret results, and what corrective actions to take when problems arise.
🎯 What You'll Learn
- Essential water quality parameters to monitor daily, ensuring optimal conditions for tilapia health and growth
- Effective testing routines and equipment choices to proactively manage water quality and prevent costly fish losses
- Strategies for maintaining stable dissolved oxygen levels to enhance feed conversion efficiency and boost your farm's profitability
Why Water Quality Matters for Tilapia
Water quality forms the foundation of successful tilapia production, yet many farmers underestimate its critical role until problems arise. Unlike terrestrial livestock that you can observe easily, fish live in an environment you cannot see into clearly, making water quality monitoring your primary window into their health and wellbeing. Poor water conditions don't just kill fish outright – they create a cascade of problems that slowly erode your farm's profitability through reduced growth rates, increased disease susceptibility, and poor feed conversion efficiency.
The Impact of Water Quality on Tilapia Health
When water quality deteriorates, your tilapia experience physiological stress that manifests in several ways. Elevated ammonia levels, even below lethal concentrations, force fish to divert energy from growth towards detoxification processes. A farmer in Kisumu discovered this firsthand when his tilapia stopped growing despite adequate feeding – water tests revealed ammonia levels of 1.2 ppm, well below the 2-3 ppm that would cause immediate mortality but high enough to halt growth completely.
Dissolved oxygen depletion creates similar hidden problems. Tilapia can survive oxygen levels as low as 2 mg/L for short periods, but optimal growth requires consistently maintaining levels above 5 mg/L. When oxygen drops to 3-4 mg/L, fish reduce feeding activity and become lethargic, directly impacting your feed conversion ratios. You might not see dead fish, but you'll certainly notice slower growth and extended production cycles that increase your costs per kilogram of fish produced.
pH fluctuations stress tilapia by affecting their ability to regulate internal salt concentrations and extract oxygen from water efficiently. Fish experiencing pH stress become more susceptible to bacterial infections, fungal diseases, and parasites. A tilapia farmer in Kampala learned this lesson when pH swings between 6.0 and 9.5 in her pond led to a bacterial outbreak that required expensive treatments and resulted in 30% mortality despite no obvious environmental triggers.

Common Water Quality Issues in Tilapia Farming
Ammonia toxicity ranks as the most frequent water quality problem in intensive tilapia systems. Decomposing feed, fish waste, and dead organic matter release ammonia, which becomes increasingly toxic as pH and temperature rise. In tropical African conditions where water temperatures often exceed 28°C, ammonia toxicity occurs at lower concentrations than in temperate climates. Farmers typically encounter problems when stocking densities exceed their system's biological filtration capacity or when overfeeding creates excess organic waste.
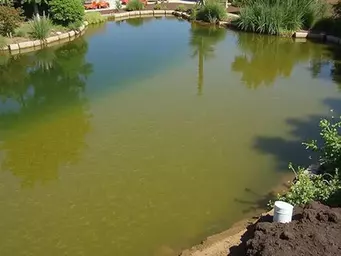
Low dissolved oxygen episodes commonly occur during hot nights, especially in ponds with heavy algae blooms or high organic loads. Algae produce oxygen during daylight hours but consume it at night, creating dangerous swings that stress fish. Many farmers lose fish during the pre-dawn hours when oxygen levels reach their daily minimum. This problem intensifies during cloudy weather when reduced photosynthesis limits daytime oxygen production.
pH fluctuations often correlate with algae activity and organic decomposition cycles. Heavily fertilised ponds or those with excessive feeding waste experience daily pH swings that stress fish continuously. Morning pH readings might be 6.8, rising to 8.8 by afternoon, then dropping again overnight. These constant changes prevent tilapia from maintaining stable internal chemistry, leading to chronic stress and reduced performance.
Benefits of Effective Water Quality Monitoring
Regular water quality monitoring allows you to identify problems before they become crises. Instead of reacting to fish kills or disease outbreaks, you can adjust management practices proactively to maintain optimal conditions. A farmer in Mombasa reduced his annual fish mortality from 25% to under 5% simply by implementing daily dissolved oxygen monitoring and installing backup aeration when levels dropped below 4 mg/L.
Consistent water quality monitoring improves feed conversion efficiency significantly. When water conditions remain optimal, tilapia convert feed to flesh more efficiently, reducing your largest operating cost. Fish farming in ideal water conditions typically achieve feed conversion ratios of 1.4-1.6:1, whilst those in poor conditions might require 2.0-2.5 kg of feed per kilogram of fish produced. Over a full production cycle, this difference can represent 30-40% of your feed costs.
Long-term economic benefits extend beyond immediate production improvements. Farms with established monitoring routines experience fewer disease outbreaks, require less medication, and achieve more predictable harvest schedules. This consistency allows better planning for market sales, reduces emergency expenses, and builds a reputation for reliable fish quality that commands premium prices from buyers.
Essential Water Quality Parameters
Successful tilapia farming requires monitoring several interconnected water quality parameters that directly influence fish health, growth, and survival. Each parameter affects others in complex ways, making comprehensive monitoring essential rather than optional. Understanding these relationships allows you to interpret test results accurately and take appropriate corrective actions before problems escalate into costly fish losses or reduced productivity.
| Parameter | Optimal Range | Effects of Poor Quality |
|---|---|---|
| pH | 6.5 - 8.5 | Stress, reduced growth, increased disease susceptibility |
| Dissolved Oxygen | 5 - 8 mg/L | Lethargy, reduced feeding, increased mortality |
| Ammonia | < 0.5 ppm | Stress, reduced growth, potential toxicity |
| Nitrite | < 0.1 ppm | Interferes with oxygen transport, stress |
| Temperature | 26 - 30°C | Reduced metabolism, stress, increased mortality |
| Turbidity | 30 - 60 cm visibility | Reduced light penetration, poor growth |
| Electrical Conductivity | 300 - 1500 µS/cm | Nutrient imbalance, stress |
pH Levels
pH measures water acidity or alkalinity on a scale from 0-14, with 7.0 being neutral. Tilapia thrive in slightly alkaline conditions between 6.5-8.5, with optimal growth occurring at 7.0-8.0. pH affects numerous biological processes including oxygen uptake efficiency, ammonia toxicity levels, and nutrient availability for beneficial bacteria that process fish waste.
Testing pH requires either digital metres, test strips, or liquid reagent kits. Digital pH metres provide the most accurate readings but require regular calibration with buffer solutions. Test strips offer convenience for daily monitoring, though they're less precise than metres. Liquid reagent kits provide good accuracy at lower cost but take more time to use. For commercial operations, invest in a quality digital metre; for smaller farms, test strips combined with periodic metre verification work well.

pH naturally fluctuates throughout the day due to photosynthesis and respiration cycles. Algae and aquatic plants consume carbon dioxide during daylight, raising pH, then release it at night, lowering pH. Daily swings of 0.5-1.0 pH units are normal, but larger fluctuations indicate problems requiring attention. Test pH at the same time daily, preferably early morning when levels are typically lowest and most stable.
Dissolved Oxygen (DO)
Dissolved oxygen represents the amount of oxygen gas dissolved in water, typically measured in milligrams per litre (mg/L) or parts per million (ppm). Tilapia require minimum levels of 3 mg/L for survival, but optimal growth demands 5-8 mg/L consistently. Higher stocking densities, warmer temperatures, and increased feeding rates all increase oxygen demand whilst reducing the water's capacity to hold dissolved gases.
Measuring dissolved oxygen requires either electronic metres or chemical test kits. Digital DO metres provide instant readings and are essential for commercial operations, though they require regular calibration and membrane replacement. Chemical test kits using titration methods offer accurate results without electronic components but take longer to complete. Some farmers use both methods, relying on metres for daily monitoring and chemical kits for verification.
Oxygen levels fluctuate dramatically in ponds with algae blooms or heavy organic loads. Photosynthesis during sunny days can push levels above 10 mg/L, whilst nighttime respiration and decomposition can drop them below 2 mg/L. Critical periods occur just before dawn when oxygen reaches daily minimums. Install aeration systems that activate automatically when levels drop below 4 mg/L, or monitor closely during high-risk periods and aerate manually when necessary.
Ammonia and Nitrite Levels
Ammonia (NH₃) forms when bacteria decompose organic matter including fish waste, uneaten feed, and dead plant material. In water, ammonia exists in two forms: toxic un-ionised ammonia (NH₃) and less harmful ionised ammonium (NH₄⁺). The ratio between these forms depends on pH and temperature – higher values increase the toxic fraction. Tilapia can tolerate total ammonia levels up to 0.5 ppm in ideal conditions, but concentrations above 0.02 ppm of un-ionised ammonia cause stress and growth reduction.
Nitrite (NO₂⁻) forms as beneficial bacteria convert ammonia through the nitrogen cycle's first stage. Whilst less toxic than ammonia, nitrite concentrations above 0.1 ppm stress tilapia by interfering with oxygen transport in their blood. Newly established systems often experience nitrite spikes as bacterial populations develop, requiring careful monitoring during the first 4-6 weeks of operation.
Testing ammonia and nitrite requires chemical test kits or electronic metres designed for aquaculture use. Test kits using colourimetric methods provide adequate accuracy for most farms and cost less than electronic alternatives. Test both parameters weekly in established systems, daily during startup periods, and immediately if fish show stress symptoms like gasping at the surface or reduced feeding activity.
Temperature and Turbidity
Water temperature directly affects tilapia metabolism, growth rates, and oxygen requirements. Optimal growth occurs between 26-30°C, with feeding and growth rates declining rapidly below 22°C or above 32°C. Temperature also influences other water quality parameters – warmer water holds less dissolved oxygen whilst increasing ammonia toxicity and bacterial activity rates.
Measure temperature using simple thermometers, digital probes, or multi-parameter metres. Take readings at consistent depths and times since surface temperatures can vary significantly from deeper water, especially in shallow ponds. Record both daily maximum and minimum temperatures to track fluctuation patterns that might stress fish.
Turbidity measures water clarity and indicates suspended particles from algae, clay, or organic matter. Moderate turbidity (30-60 cm Secchi disk visibility) benefits tilapia ponds by supporting beneficial algae growth and providing natural food sources. Excessive turbidity blocks sunlight needed for photosynthesis, whilst crystal-clear water often indicates insufficient natural productivity. Monitor turbidity using a Secchi disk – a white disk lowered into water until it disappears from view.
Electrical Conductivity (EC) and Salinity
Electrical conductivity measures dissolved salts and minerals in water, indicating overall water chemistry and nutrient levels. Tilapia tolerate wide EC ranges from 100-3000 microsiemens per centimetre (µS/cm), with optimal levels between 300-1500 µS/cm for freshwater systems. Very low conductivity indicates soft water that might lack essential minerals, whilst extremely high levels suggest pollution or excessive fertilisation.
Salinity becomes important when farming brackish water species or in coastal areas where salt intrusion affects freshwater sources. Nile tilapia tolerate salinities up to 15 parts per thousand (ppt), whilst some hybrids handle even higher levels. Measure salinity using refractometers or conductivity metres with salinity conversion functions.
Test EC and salinity weekly in stable systems, more frequently when using new water sources or during seasonal changes that might affect mineral content. Sudden changes in these parameters often indicate pollution events or water source problems requiring immediate investigation and possible corrective action.
Monitoring Equipment Options
Choosing appropriate water quality monitoring equipment requires balancing accuracy needs, budget constraints, and operational convenience for your specific farming situation. Equipment options range from simple test kits costing a few thousand naira to sophisticated automated systems exceeding several million naira. Understanding each option's capabilities and limitations helps you invest wisely in tools that genuinely improve your farm's productivity rather than simply collecting dust after initial enthusiasm wanes.
| Equipment Type | Features | Cost Range (Naira) | Best Use |
|---|---|---|---|
| Handheld pH Metre | Portable, accurate, requires calibration | 15,000 - 45,000 | Small to medium farms |
| Continuous DO Monitor | Automated, real-time data, alerts | 65,000 - 150,000 | Intensive systems |
| Ammonia Test Kit | Cost-effective, requires time, accurate | 2,500 - 6,000 | General use |
| Turbidity Metre | Measures water clarity, easy to use | 10,000 - 50,000 | Pond monitoring |
Handheld Metres vs. Continuous Monitors
Handheld metres offer portability and versatility for farmers managing multiple ponds or visiting different farm sites regularly. Quality units measure multiple parameters including pH, dissolved oxygen, temperature, and conductivity in a single device. A farmer in Ibadan uses a handheld multi-parameter metre costing 85,000 naira to test six different ponds daily, recording results in a logbook for trend analysis. These metres require regular calibration and careful handling but provide laboratory-quality results at farm sites.
Continuous monitoring systems automatically measure and record water quality parameters at preset intervals, often transmitting data wirelessly to smartphones or computers. These systems excel at detecting rapid changes that manual testing might miss, particularly dissolved oxygen fluctuations during critical nighttime periods. A commercial tilapia farm near Nairobi installed continuous DO monitors in their high-density tanks, preventing three potential fish kills during the first year of operation by triggering automatic aeration systems when oxygen levels dropped below 4 mg/L.

Cost-benefit analysis favours handheld metres for smaller operations or farms with stable water conditions, whilst continuous monitors justify their expense in intensive systems where rapid parameter changes pose significant risks. Consider your farm's stocking density, production value, and labour availability when choosing between manual and automated monitoring approaches.
Essential Equipment for Water Quality Monitoring
pH metres represent your most critical monitoring tool since pH affects virtually every other water quality parameter. Digital pH metres from manufacturers like Hanna Instruments or YSI provide accurate readings with proper calibration and maintenance. Budget 15,000-45,000 naira for a quality handheld pH metre, plus ongoing costs for calibration buffers and electrode replacement. Cheaper alternatives include pH test strips (500-1,500 naira per pack) that provide adequate accuracy for routine monitoring.
Dissolved oxygen sensors require more sophisticated technology but are essential for intensive tilapia systems. Optical DO sensors offer better accuracy and require less maintenance than traditional membrane-based sensors, though they cost more initially. Expect to spend 65,000-150,000 naira for a quality handheld DO metre. Chemical DO test kits provide backup capability at 3,000-8,000 naira per kit but require more time and skill to use accurately.
Ammonia test kits remain the most practical option for most farms since electronic ammonia metres are expensive and require frequent maintenance. Colourimetric test kits from API, Salifert, or Hach provide sufficient accuracy for aquaculture applications at 2,500-6,000 naira per kit. Test weekly in established systems, daily during startup or when problems are suspected.
Cost Considerations for Monitoring Equipment
Equipment costs vary dramatically based on accuracy requirements, automation levels, and brand selection. A basic monitoring setup including pH metre, DO metre, and chemical test kits for ammonia and nitrite costs 85,000-200,000 naira initially, plus 20,000-40,000 naira annually for calibration solutions, replacement parts, and test kit refills. This investment typically pays for itself within one production cycle through reduced mortality and improved growth rates.
Return on investment calculations should consider both direct savings from prevented fish losses and indirect benefits from optimised production efficiency. A farmer in Kumasi calculated that his 120,000 naira investment in monitoring equipment prevented an estimated 180,000 naira in fish losses during his first year, whilst improved growth rates increased harvest weights by 15% worth an additional 240,000 naira in revenue.
Budget for ongoing maintenance and calibration costs when evaluating equipment options. Electronic metres require regular calibration using buffer solutions costing 8,000-15,000 naira annually. Sensor membranes and electrodes need replacement every 6-18 months depending on usage intensity. Factor these recurring costs into your operational budget rather than treating them as unexpected expenses.
IoT and Automated Monitoring Solutions
Internet of Things (IoT) monitoring systems represent the cutting edge of aquaculture technology, offering real-time data collection, cloud-based storage, and smartphone alerts when parameters exceed preset limits. These systems typically include multiple sensors, wireless data transmission, and web-based dashboards for trend analysis and record keeping. A progressive tilapia farm in Cape Town installed an IoT system monitoring pH, DO, temperature, and conductivity across eight production units, receiving instant alerts whenever conditions require attention.
Automated monitoring provides particular value for intensive systems where rapid parameter changes can cause significant losses quickly. Night-time dissolved oxygen crashes, pH spikes from algae blooms, or temperature fluctuations from equipment failures all trigger immediate alerts allowing prompt corrective action. The same Cape Town farm prevented an estimated 400,000 rand in losses during their first year by responding quickly to automated alerts.
Cost considerations for IoT systems include initial hardware (150,000-800,000 naira depending on complexity), installation, and ongoing data service fees. Monthly connectivity costs typically range from 3,000-12,000 naira depending on data volumes and service providers. Evaluate these systems based on your farm's production value, technical capabilities, and risk tolerance for equipment-dependent operations in areas with unreliable power or internet connectivity.
Daily Testing Routines
Establishing consistent daily testing routines transforms water quality monitoring from a reactive crisis response into a proactive management tool that prevents problems before they impact fish health or growth. Successful routines balance thoroughness with practicality, ensuring you collect essential data without creating burdensome procedures that eventually get abandoned. The key lies in developing sustainable practices that fit naturally into your existing farm management schedule whilst providing early warning of developing problems.
| Parameter | Frequency | Best Time to Test | Duration |
|---|---|---|---|
| pH | Daily | Early morning | 5 minutes |
| Dissolved Oxygen | Daily | Early morning | 5 minutes |
| Temperature | Daily | Early morning | 5 minutes |
| Ammonia | Weekly | Morning | 15 minutes |
| Nitrite | Weekly | Morning | 15 minutes |
| Turbidity | Weekly | Midday | 10 minutes |
Establishing a Daily Testing Schedule
Morning testing provides the most reliable baseline readings since water conditions are typically most stable after the overnight equilibration period. Test between 6:00-8:00 AM before feeding or major farm activities that might temporarily alter water chemistry. This timing captures minimum dissolved oxygen levels, stable pH readings, and allows detection of overnight problems that require immediate attention.
Essential daily tests include temperature, dissolved oxygen, and pH measurements taking approximately 10-15 minutes per pond using handheld metres. A farmer in Kisumu tests four ponds each morning in 45 minutes, recording results in a waterproof notebook before beginning feeding routines. Weekly tests for ammonia, nitrite, and turbidity add another 20-30 minutes but provide crucial data for detecting developing problems.

Seasonal adjustments to testing schedules account for changing conditions throughout the year. During hot dry seasons, increase dissolved oxygen monitoring frequency since higher temperatures reduce oxygen solubility whilst increasing fish metabolism. Rainy seasons require more frequent pH and turbidity testing as runoff affects water chemistry. A tilapia farmer in northern Ghana doubles his testing frequency during harmattan season when dust and temperature fluctuations stress fish more severely.
Manual Testing Procedures
Proper sampling technique ensures accurate, representative test results that reflect actual pond conditions rather than measurement artefacts. Collect water samples from multiple locations within each pond, avoiding areas near feeders, aerators, or inflow pipes where conditions might differ significantly from the main water body. Sample at consistent depths – typically 30-50 cm below surface in shallow ponds or mid-depth in deeper systems.
pH testing requires clean, calibrated equipment and proper sample handling. Rinse pH electrodes with distilled water between samples to prevent cross-contamination. Calibrate metres weekly using fresh buffer solutions stored properly to maintain accuracy. When using test strips, dip quickly and compare colours immediately since readings change as strips dry. Record results promptly since memory can be unreliable when testing multiple ponds sequentially.
Dissolved oxygen measurements demand particular care since readings change rapidly when samples are exposed to air. Insert DO probes directly into pond water rather than collecting samples in containers. Allow readings to stabilise for 2-3 minutes before recording results. Clean probe membranes weekly and replace them every 6-12 months depending on usage intensity. Store metres properly between uses to prevent damage from moisture or extreme temperatures.
Interpreting Test Results
Understanding normal parameter ranges for your specific system allows you to distinguish between acceptable fluctuations and concerning trends requiring action. Newly established ponds often show different patterns than mature systems with stable biological communities. A concrete tank system in Lagos typically maintains pH between 7.2-7.8 daily, whilst an earthen pond in the same location might fluctuate between 6.8-8.2 due to soil buffering and algae activity.
Trend analysis provides more valuable information than individual readings. Gradual pH increases over several days might indicate developing algae blooms, whilst slowly declining dissolved oxygen levels could signal increasing organic loads or equipment problems. A farmer in Accra prevented a major fish kill by recognising that morning DO readings had dropped from 6.5 mg/L to 4.8 mg/L over one week, prompting investigation that revealed a blocked aerator intake.
Abnormal results require immediate investigation and often prompt additional testing to confirm findings and identify causes. Single unusual readings might result from measurement errors, but consistent abnormalities indicate real problems requiring corrective action. When pH exceeds 8.5 or drops below 6.5, test multiple locations within the pond and consider factors like recent feeding, weather changes, or equipment malfunctions that might explain the deviation.
Seasonal Water Quality Management
Dry season management focuses primarily on temperature control and dissolved oxygen maintenance as evaporation concentrates nutrients whilst higher temperatures stress fish and reduce oxygen solubility. Increase aeration during hot periods and consider partial water changes if temperatures consistently exceed 32°C. A farmer in Kano installed shade cloth over his ponds during peak dry season, reducing afternoon temperatures by 3-4°C and improving fish feeding activity significantly.
Rainy season challenges include dilution of beneficial minerals, pH fluctuations from runoff, and increased turbidity from soil erosion. Monitor electrical conductivity more frequently during heavy rains to detect mineral depletion that might require supplementation. Install proper drainage around ponds to prevent contaminated runoff from entering production systems. A farmer in Kumasi prevented major losses during flooding by constructing elevated berms that diverted surface water away from his ponds.
Harmattan season in West Africa creates unique challenges with dust contamination, extreme temperature fluctuations, and reduced humidity affecting evaporation rates. Cover ponds partially during severe dust storms and increase water replacement rates to compensate for higher evaporation. Monitor ammonia levels more frequently since concentrated conditions increase toxicity risks. Adjust feeding schedules to avoid peak temperature periods when fish are most stressed.
Conclusion
Water quality monitoring transforms tilapia farming from guesswork into predictable production, and you now have the knowledge to implement effective monitoring routines on your farm. Start with daily morning tests of pH, dissolved oxygen, and temperature using affordable handheld metres or test kits, then add weekly ammonia and nitrite monitoring as your system stabilises. Remember that consistent testing matters more than expensive equipment—a simple pH metre and DO test kit used religiously will prevent more problems than sophisticated monitors gathering dust in your office.
The monitoring routines outlined here might seem overwhelming initially, but they quickly become second nature with practice. Your fish will teach you to read the subtle signs that accompany changing water conditions, and within a few production cycles, you'll instinctively know when something needs attention before your test results confirm it. Trust the process and give yourself time to develop this essential skill—every successful tilapia farmer has walked this same learning path.
Effective water quality management creates the foundation for everything else in tilapia production to work properly. With stable, optimal water conditions, your fish will respond better to feeding programmes, resist diseases more effectively, and grow to market size faster. Your next focus should be developing efficient feeding strategies that complement your water quality management, as these two elements work together to maximise growth rates and profitability. Master water quality first, then build your feeding expertise on this solid foundation.
Frequently Asked Questions
What are the absolute minimum water quality parameters I should monitor daily, even on a tight budget?
You should prioritise daily monitoring of temperature and dissolved oxygen (DO), especially in the early morning when levels are lowest. Even simple thermometers and basic chemical DO test kits can provide crucial information to prevent fish stress and mortality, as optimal growth demands DO levels of 5-8 mg/L. Checking pH with test strips is also highly recommended to catch significant fluctuations.
How can I tell if my tilapia are stressed by poor water quality even if I don't see dead fish?
Tilapia under water quality stress will often show reduced feeding activity, lethargy, or gasp at the water's surface, even if parameters aren't immediately lethal. For example, ammonia levels as low as 1.2 ppm can halt growth, and oxygen levels of 3-4 mg/L cause reduced feeding. Monitoring these behaviours alongside your water tests will help you intervene before major issues develop.
When should I invest in more advanced water quality monitoring equipment like digital metres or continuous monitors?
You should consider investing in more advanced equipment like digital multi-parameter metres or continuous monitors when your farm's stocking density increases, or if you consistently experience problems that manual testing misses. Continuous DO monitors, for instance, are highly beneficial in intensive systems to detect rapid nighttime oxygen crashes and trigger automatic aeration, preventing significant losses.
Why do pH levels fluctuate so much in my pond, and what does it mean for my tilapia?
pH naturally fluctuates throughout the day due to photosynthesis and respiration cycles, with algae consuming carbon dioxide during the day (raising pH) and releasing it at night (lowering pH). Large swings, especially between 6.0 and 9.5, stress tilapia by affecting their ability to regulate internal salt concentrations and extract oxygen, making them more susceptible to diseases. Monitoring these daily fluctuations is key to maintaining a stable environment.
How can I reduce high ammonia levels in my pond if my test kit shows them as too high?
To reduce high ammonia levels, you should first reduce feeding to minimise new waste input, and consider increasing aeration to support beneficial bacteria. Partial water changes can also help dilute ammonia quickly. Regularly cleaning uneaten feed and organic matter from your pond bottom is also crucial, as decomposing waste is a primary source of ammonia.


Yomi Adisa Lead Researcher
Yomi Adisa is the lead researcher at Fish Farming Business, where he studies what makes aquaculture ventures profitable across Africa. His research focuses on market patterns, buyer preferences, and the business decisions that determine success or failure in fish farming.